


Free Cash Flow Deep Dive: Apple Inc.
Apple of my eye or bad apple?


Overview
Apple Inc. (AAPL), a member of the magnificent 7 stocks, has been tarnished of late with news of U.S. and European regulators announcing investigations into antirust/monopolistic activities. Apple previously had been a highflier and has appeared on my screens regularly as one of the most consistent cash flow generators among Russell 3000 companies. In today’s post we take a deep dive into Apple’s cash flows over time and how regulatory sanctions might impact future cash flows and growth in cash flows.
Why Focus on Cash Flow?
When you are purchasing stock in a company, you are buying a piece of the business. You are an owner, as opposed to a creditor that is loaning money to the company. Whether buying 100 shares or a substantial percentage of a company, you should evaluate the investment as an owner. Successful companies must generate revenues by selling their goods or services at a higher price than the all-in costs of providing those goods or services. In the long run, the business must generate both revenues and profits. It must also turn those revenues and profits back into cash which can be distributed to owners, used to pay creditors, or reinvested in the business. Not all companies are equally successful at this last step. They may be generating sales by allowing very lax credit terms, and it may take a long time (if ever) to collect on those sales. Many companies with rapidly growing revenues have ended up in bankruptcy as a result. In evaluating a company, you need to look at many factors. Four critical factors are the ability to generate revenues, grow those revenues over time (otherwise you will not keep up with inflation!), generate profits from those revenues, and turn those profits into cash flow. You cannot pay your bills with net income alone – cold hard cash is required.
Background information on cash flow ratios and Russell 3000 summary data on cash flow ratios can be found at:
Evaluating Stocks using Free Cash Flow - by Tom Robinson (substack.com)
Disclosures
Unless otherwise specified data is as of March 26, 2024, and sourced from Y-Charts. I currently have a long position in AAPL.
Apple’s Performance over the Past Decade
Apple generates close to $400 billion in annual revenue. Recent financial statement data is presented below:
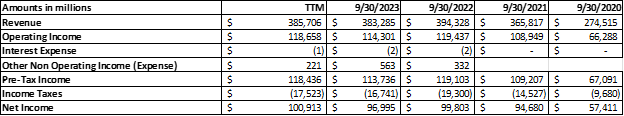
Looking back further, over the past 10 years Apple’s revenue has grown at a compound rate of 7.8% per year. Apple’s revenue, operating income and net income grew fairly consistently over those 10 years with some flat years. Overall, its compound growth in operating income and net income were 8.5% and 9.8% respectively. This indicates very good operating leverage and the ability to grow income faster than revenue.
Apple consistently converts its net income into operating cash flow and its operating cash flow consistently exceeds net income as shown below:
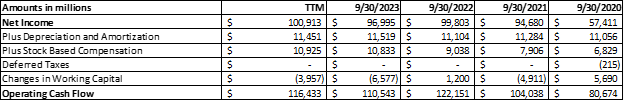
Looking back over 10 years shows that operating cash flow divided by net income is consistently above 100% showing that the company consistently generates more operating cash flow to net income and that earnings are of high quality (not impacted by a large amount of accruals that companies use to boost net income). Apple’s compound growth in operating cash flow over the last decade has been about 6.9%.
My primary focus when analyzing cash flow is free cash flow to the firm. This is the metric most used by analysts in valuing a firm (you can see my articles and books on the subject such as Equity valuation: A survey of professional practice - Pinto - 2019 - Review of Financial Economics - Wiley Online Library and Amazon.com: Equity Asset Valuation (CFA Institute Investment Series): 9781119628101: Pinto, Jerald E.: Books – I receive no royalties on these).
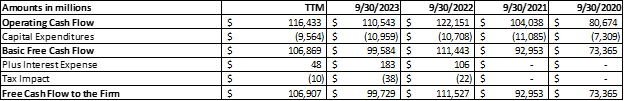
First, we compute basic free cash flow is the cash flow generated from operating the business minus the additional cash capital expenditures we need to replace and grow our property, plant and equipment.
Companies have two main ways of raising capital to operate the business – debt and equity (stock). Free cash flow is needed to repay BOTH over the long term. Analysts use basic free cash flow with one adjustment to determine Free Cash Flow to the Firm (FCFF) – the free cash flow generated by the business that is available to pay both creditors and investors. The adjustment that is required is related to interest expenses. Under U.S. accounting principles, interest expense paid to creditors is an operating cash outflow, so we add that back to basic free cash flow adjusted for the impact of taxes. The resulting FCFF represents the free cash flow available to both debt and equity capital providers before any payments to those providers. FCFF can be reinvested in the business, used to repay creditors, or used to repay stockholders. The latter could be in the form of dividends or stock buybacks. Another similar metric is free cash flow to equity holders only (FCFE) however it is impacted by borrowing and debt repayment had its trend is not a reliable indicator of future trends. In Apple’s case they have little debt so we could look at either FCFF or FCFE.
Apple’s recent FCFF is presented below:
Apple’s recent FCFE is presented below:

Apple has been a very consistent generator of FCFF and FCFE over the past decade as shown in the graph below.
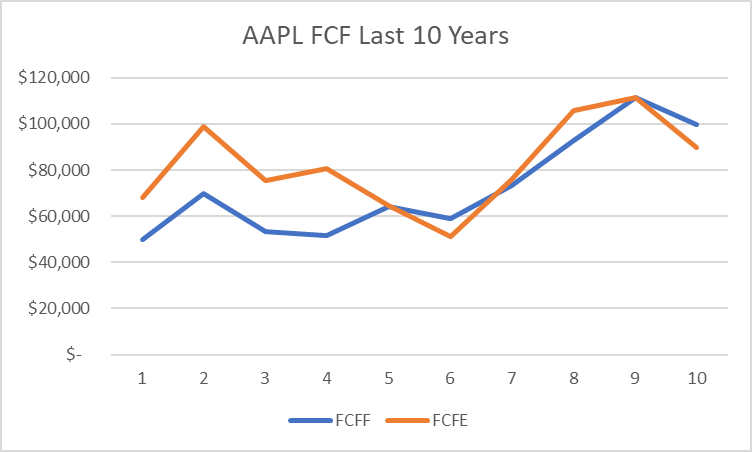
Apple’s compound growth in FCFF over the past decade has been 7.9%. Growth in FCFE was 4.2% over the same period.
To compare with other firms, we need to compute ratios. Two useful FCFF ratioa are FCFF Margin (FCFF/Revenue) and FCFF Return on Assets (FCFF/Total Assets). Apple’s FCFF Margin has averaged about 26% for the past decade. This means that Apple has normally generated about $26 of FCFF for every $100 of revenue. This compares very favorably to the broader market. The median FCFF Margin for Russell 3000 for which FCFF data is available is currently 10.3%. Apples FCFF Margin places it in the top 20% of Rusell 3000 companies.
Recent data for FCF Margins and ROA are:

Apple’s FCF Margin over the past decade is shown below.

Apple’s FCFF ROA is also stable as shown below:
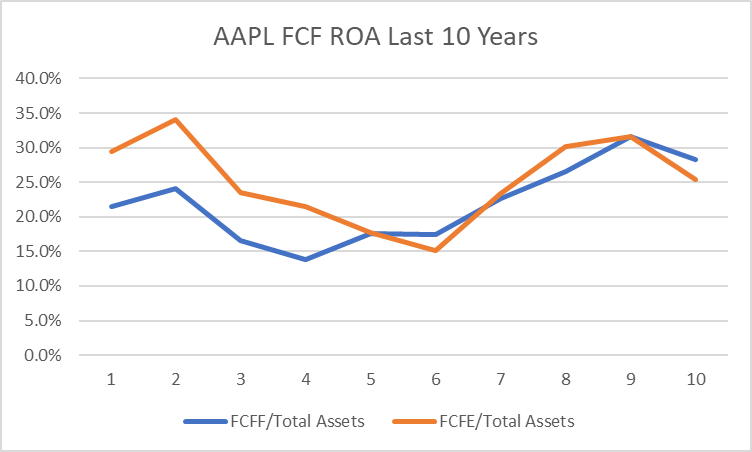
Current data for the Russell 3000 is:

Apple’s FCF Margins using both FCFF and FCFE are in the top 20% if the Russell 3000 while FCF ROA using both FCFF and FCFE places Apple well into the top decile. Apple is clearly one of the strongest and most consistent cash flow generators looking at the past decade. The big question is how much Apple will be impacted by regulatory actions. Clearly regulators want to open Apple’s products and platforms to competition. This is likely to impact cash flow margins and growth in cash flows to some extent, however, cash flow margins are likely to remain much higher than most other companies.
Keep reading with a 7-day free trial
Subscribe to Positive Alpha Education to keep reading this post and get 7 days of free access to the full post archives.