Screening For the Most Consistent Cash Flow Generating Companies
Consistency is the Key: FCFF Relative to Total Assets at least 7.5% per year
As I have noted in other posts, a company’s ability to generate cash flows from earnings is as important as its ability to generate earnings. Cash is ultimately needed to grow the firm and repay both creditors and investors – both a return of capital over time and a return on capital. The most important cash flow measure in my view is free cash flow to the firm (FCFF). FCFF is pre-interest operating cash flow less capital expenditures. This is the cash that is available to repay both investors and creditors. It can be used to evaluate the consistency of cash flows, the historical growth in cash flows and to value the enterprise as a whole. Free cash flow to equity is the cash flow after net debt issuance or repayment that is available to shareholders. While it is ultimately of interest to shareholders, FCFE can very quite a bit when the company has some years of net debt payment and others of net debt issuance. Company’s can generate FCFE simply by borrowing. While this increased FCFE in the current year, it will reduce future FCFE. I recommend focusing on a company’s ability to generate FCFF and using that information to forecast reasonable amounts of FCFE that could be generated in the future.
To compare a company’s FCFF generating ability of time and to other companies you might invest in, you should look at FCFF ratios. My preferred ratio that is blind to current valuation is FCFF/Total Assets. Think of this as a cash flow-based return on assets. At the beginning of 2024 the FCFF/Total Assets ratio for the stocks in the Russell 3000 look like this:
The median company in the Russell 3000 generated FCFF/TA of 4.1%. In other words, for every $100 invested in total assets the median company generates $4.0 of FCFF. Companies in the top decile generate almost 4 times as much FCFF - $15.70 per $100 invested in total assets.
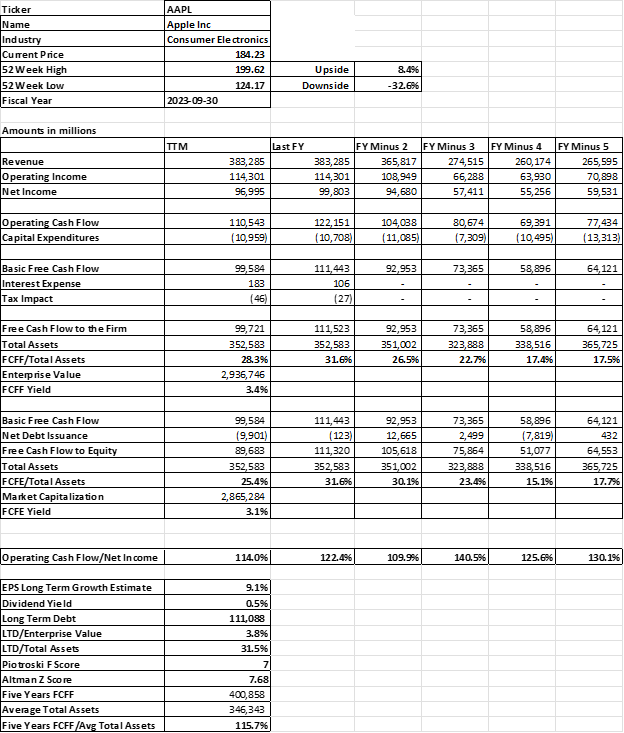
Apple is a good example of a consistent FCFF generator (and is typically priced at a premium as a result!). Apple generates more FCFF in a single year than all other companies in the Russell 3000 – almost $100 billion. The exhibit below shows its FCFF/Total Assets over time as well as other important cash flow ratios:
In the last couple of years Apple has had a FCFF/TA ratio of almost 30%. Its lowest FCFF/TA ratio over the last five years was 17.4%. As a result, Apple tends to be richly valued by investors. It is currently priced at a FCFF Yield of about 3.4% and a FCFE Yield of 3.1%. If an investor buys Apple and it never grew its cash flow, the investors expected return would be only about 3%. It is clear that investors expect growth over time. Looking at analysts’ future EPS forecasts, it looks like the consensus is about 9.1%. If they could grow FCFF and FCFE by this same amount, then an expected return would be about 12% (expected FCFE yield + expected growth). As the market and analysts absorb new information and recalibrate their growth forecasts, Apple stock price should be expected to recalibrate as well. And it has indeed done that in the last few days as questions arose about Apple’s growth prospects.
What other companies are strong and consistent FCFF generators. For this purpose, I prefer to screen on which companies generate a high level of FCFF/TA over the last five years. Specifically, I prefer to see which companies generate in the top 30% of FCFF/TA in at least 4 of the last 5 years (about 7.5% per year and allowing for a little slack during the COVID pandemic). I include other important screening factors as well such as:
Ability to Generate Cash Flows
Five years of positive cumulative free cash flow to the firm and net income
High free cash flow to the firm relative to total assets over the past five years
Increasing free cash flow to the firm over the last five years (also relates to growth)
Stable or increasing free cash flow to the firm relative to total assets
Operating cash flow over the last five years higher than earnings over the last five years
Valuation/Growth
For this screen, I prefer to focus on high cash flow generators and do not place a restriction on FCFF yield (FCFF/EV) other than to require that it is not negative. The screen is designed to pick up both value and growth opportunities.
Similarly, I do not set a minimum growth estimate as long as it is not negative.
I do, however, want to limit the results of the screens to those where the potential total return in terms of both FCF Yield and growth is at least 10%. Particularly in the current environment when you can get 5% on TBills.
Quality
Inclusion in the Russell 3000 but avoiding very low priced stocks.
High Piotroski F Score
High Altman Z Score
Reasonable debt levels
Consistency in generating free cash flow to the firm over the last five years
Operating cash flow over the last five years higher than earnings over the last five years
Reasonable levels of executive stock-based compensation relative to enterprise value
This screen results in 110 Russell 3000 companies that are the strongest, consistent FCFF generators. This list of stocks is worthy of additional analysis and a formal valuation to consider as an investment opportunity:
The full list with cash flow ratios can be downloaded by paid subscribers here:
Keep reading with a 7-day free trial
Subscribe to Positive Alpha Education to keep reading this post and get 7 days of free access to the full post archives.


